jGRASP Plugin for IntelliJ
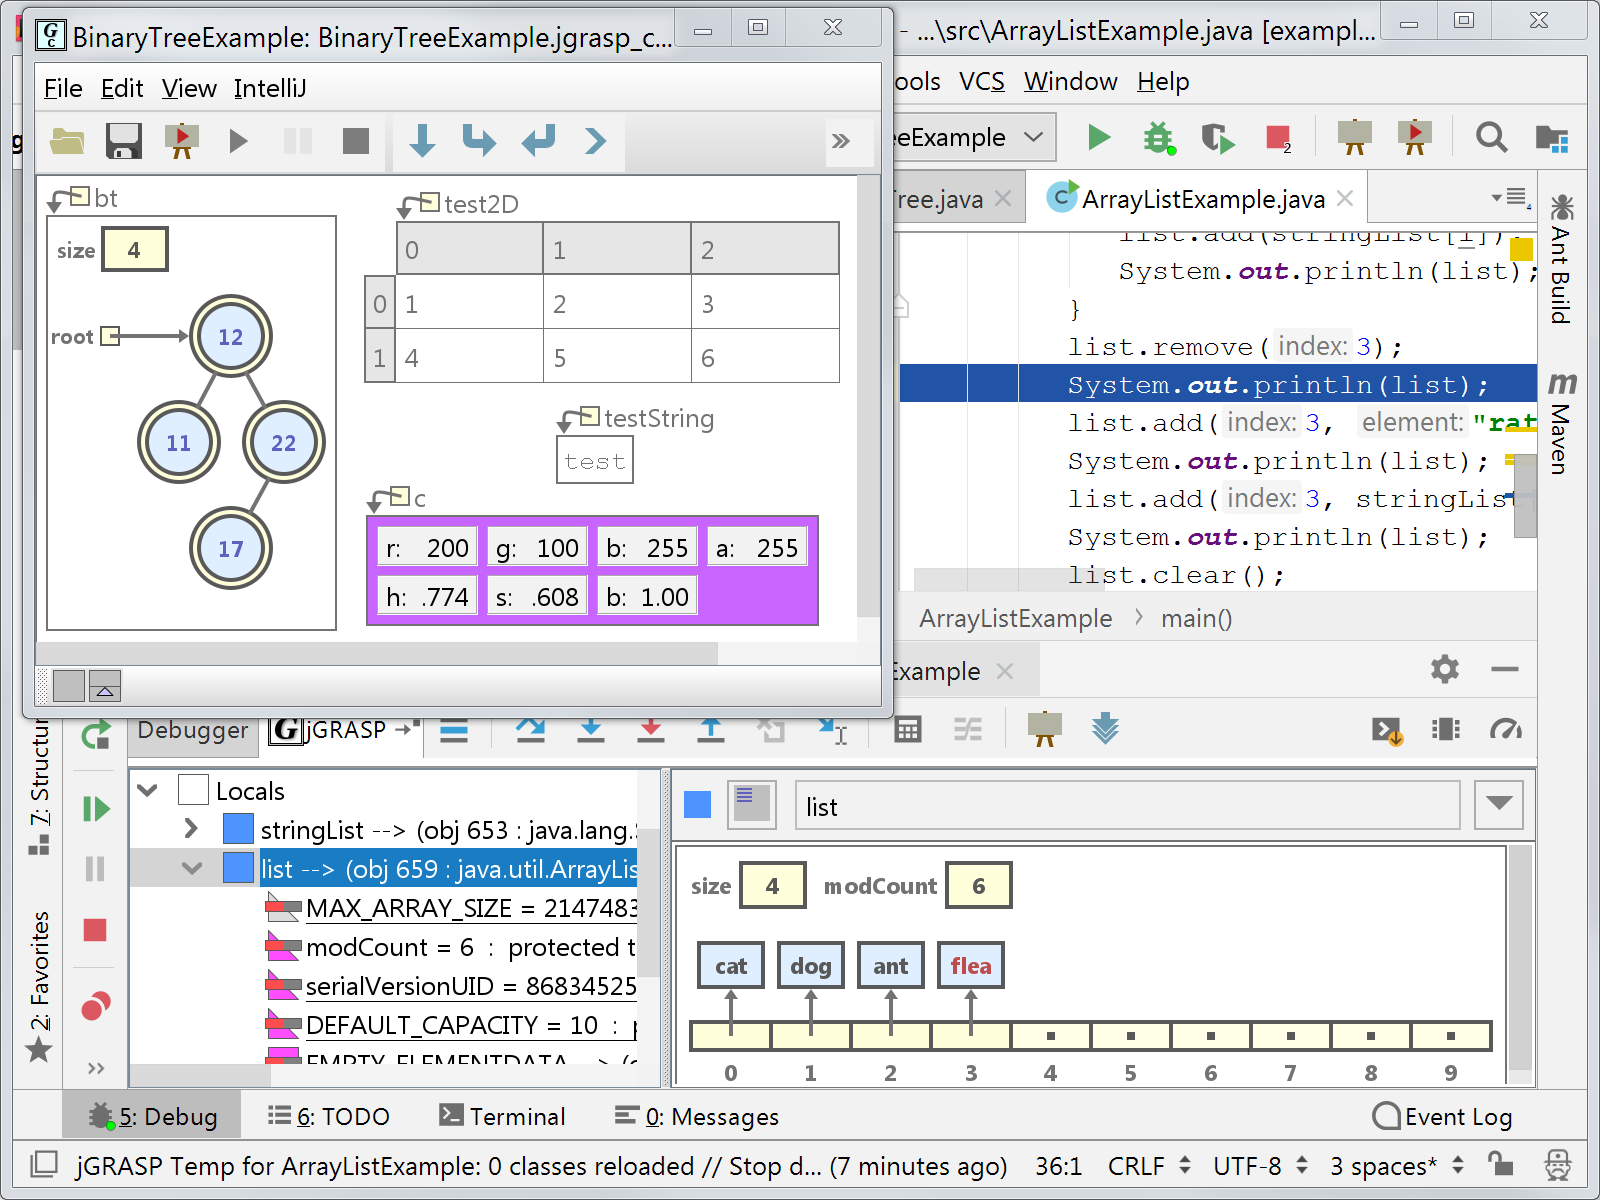
The jGRASP Plugin for IntelliJ brings the jGRASP viewers and viewer canvas to the IntelliJ Java and Kotlin debugger in IDEA, Android Studio, and other IntelliJ-derived Java and/or Kotlin IDEs.
import java.util.ArrayList;

public class ArrayListDemo {
    public static void main(String[] args) {
        ArrayList<String> cars = new ArrayList<String>();
        cars.add("Volvo");
        cars.add("BMW");
        cars.add("Ford");
        cars.add("Mazda");
        System.out.println(cars);
    }
}
// class to create nodes
class Node {
    int key;
    Node left, right;

    public Node(int item) {
        key = item;
        left = right = null;
    }
}

class BinaryTreeDemo {
    Node root;

    // Traverse tree
    public void traverseTree(Node node) {
        if (node != null) {
            traverseTree(node.left);
            System.out.print(" " + node.key);
            traverseTree(node.right);
        }
    }

    public static void main(String[] args) {

        // create an object of BinaryTree
        BinaryTreeDemo tree = new BinaryTreeDemo();

        // create nodes of the tree
        tree.root = new Node(1);
        tree.root.left = new Node(2);
        tree.root.right = new Node(3);
        tree.root.left.left = new Node(4);

        System.out.print("\nBinary Tree: ");
        tree.traverseTree(tree.root);
    }
}

VisualVM IDE Integrations
Use the VisualVM features from within your favorite Java IDE!
Open sources from VisualVM results in your favorite Java IDE! Learn how.
NetBeans
Use the profiler in Apache NetBeans (3rd party) to analyze code within the NetBeans IDE. It utilizes a profiling engine similar to VisualVM and is tightly integrated into the IDE. Home »
Eclipse
Use the Eclipse Launcher to integrate VisualVM with the Eclipse IDE. The plugin enables starting VisualVM along with the executed application and automatically opens the application tab.
Installation: download the plugin (.zip, 68.1KB), unzip it and add as a local update site, then install the VisualVM Launcher Feature.
Configuration: setup the plugin by configuring path to JDK (not JRE) and VisualVM installation using Run/Debug-Launching-VisualVM Configuration.
Usage: create a custom application configuration and choose the VisualVM Launcher as application launcher for the Run/Debug actions.
IntelliJ IDEA
Use the VisualVM Launcher (3rd party) to integrate VisualVM with IntelliJ IDEA. The plugin enables starting VisualVM along with the executed application. Home »
VS Code
Install the GraalVM Tools for Java extension and start VisualVM along with the project and/or control the VisualVM session from within the VS Code. Supports opening sources from VisualVM results back in the VS Code editor. Home »
IBM Pattern Modeling and Analysis Tool for Java Garbage Collector (PMAT)
How To
Summary
IBM Pattern Modeling and Analysis Tool for Java Garbage Collector is a tool that parses verbose GC trace, analyzes Java heap usage, and recommends key configurations based on pattern modeling of Java heap usage.
Objective
- Download: https://www14.software.ibm.com/cgi-bin/weblap/lap.pl?popup=Y&la_formnum=&li_formnum=L-JHWG-85RFJN&accepted_url=https://public.dhe.ibm.com/software/websphere/appserv/support/tools/pmat/ga458.jar
- Open a terminal or command prompt and change directory to where you downloaded the JAR file.
- Ensure that Java is on your PATH to run the tool.
- Launch the tool:
java -Xmx1g -jar ga*.jar
Environment

- GC analysis
- GC table view
- Allocation failure summary
- GC usage summary
- GC duration summary
- GC graph view
- GC pattern analysis
- Zoom in/out/selection/center of chart view
- Option of changing chart color.
- Serial collector
- Throughput/parallel collector
- Concurrent collector
- Incremental/train collector
jhat - Java Heap Analysis Tool
SYNOPSIS
jhat [ options ] <heap-dump-file>
PARAMETERS
- options
- Options, if used, should follow immediately after the command name.
- heap-dump-file
- Java binary heap dump file to be browsed. For a dump file that contains multiple heap dumps, you may specify which dump in the file by appending "#<number> to the file name, i.e. "foo.hprof#3".
DESCRIPTION
The jhat command parses a java heap dump file and launches a webserver. jhat enables you to browse heap dumps using your favorite webbrowser. jhat supports pre-designed queries (such as 'show all instances of a known class "Foo"') as well as OQL (Object Query Language) - a SQL-like query language to query heap dumps. Help on OQL is available from the OQL help page shown by jhat. With the default port, OQL help is available at http://localhost:7000/oqlhelp/
There are several ways to generate a java heap dump:
- Use jmap -dump option to obtain a heap dump at runtime;
- Use jconsole option to obtain a heap dump via HotSpotDiagnosticMXBean at runtime;
- Heap dump will be generated when OutOfMemoryError is thrown by specifying -XX:+HeapDumpOnOutOfMemoryError VM option;
- Use hprof.
NOTE: This tool is experimental and may not be available in future versions of the JDK.
OPTIONS
- -stack false/true
- Turn off tracking object allocation call stack. Note that if allocation site information is not available in the heap dump, you have to set this flag to false. Default is true.
- -refs false/true
- Turn off tracking of references to objects. Default is true. By default, back pointers (objects pointing to a given object a.k.a referrers or in-coming references) are calculated for all objects in the heap.
- -port port-number
- Set the port for the jhat's HTTP server. Default is 7000.
- -exclude exclude-file
- Specify a file that lists data members that should be excluded from the "reachable objects" query. For example, if the file lists java.lang.String.value, then, whenever list of objects reachable from a specific object "o" are calculated, reference paths involving java.lang.String.value field will not considered.
- -baseline baseline-dump-file
- Specify a baseline heap dump. Objects in both heap dumps with the same object ID will be marked as not being "new". Other objects will be marked as "new". This is useful while comparing two different heap dumps.
- -debug int
- Set debug level for this tool. 0 means no debug output. Set higher values for more verbose modes.
- -version
- Report version number and exit.
- -h
- Output help message and exit.
- -help
- Output help message and exit.
- -J<flag>
- Pass <flag> to the Java virtual machine on which jhat is run. For example, -J-Xmx512m to use a maximum heap size of 512MB.
- Some features of the plugin require a paid subscription. Learn moreCompatible with all IntelliJ-based IDEs


No comments:
Post a Comment